It is official. Britain has had the wettest summer since 1912 according to the Meteorological Office. This follows one of the wettest springs on record. Is this evidence of climate change or simply natural variation in the weather?
To try answering this question, data from a weather station near Glasgow has been analysed . The first part of this article presented annual rainfall records and concluded that there has been only a slight increase in annual rainfall over the past decade compared with a baseline of 1961 to 1990 but that there had been a marked increase in variability. Also of interest is whether rainfall patterns have changed throughout the year, from month to month and between the seasons which is the subject of this post.
In order to provide some context, June 2012 was the wettest recorded June in 54 years with 130mm of rainfall which is almost double(196%) the average rainfall for the month and July is the fourth wettest with 75% more than average. Apart from this year, the five wettest Junes were followed by an average or below average July and likewise the five wettest Julies were preceded with a dry or average June. Data for August 2012 has yet to be published.
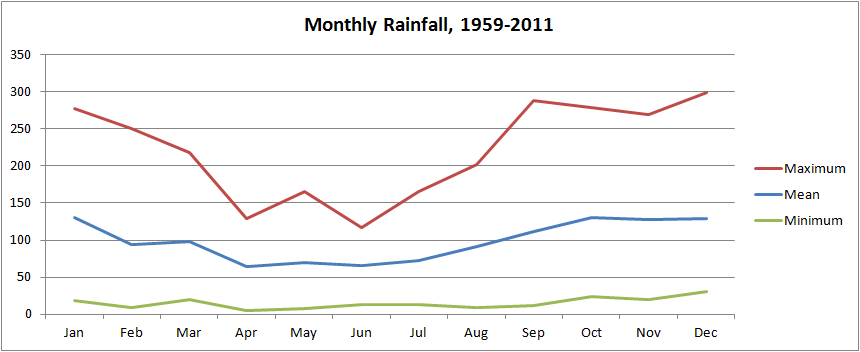
Over the fifty three complete years of data examined, there are wide variations in rainfall for each month as demonstrated by the monthly mean, maximum and minimum values plotted below. In some months the minimum values are almost zero while the maximum values may be almost three times the minimum.
Read more »
Summer 2012 may be remembered for the Olympic Games. Or it may be remembered for the rain. From doom laden predictions of the worst drought for a generation in the southern half of Britain with disastrous consequences for farmers in the spring to torrential rain, floods and, yes, disastrous consequences for farmers in the summer.
The burning question is whether this is just the natural variability of weather or whether underlying climate change has a hand in driving these weather systems. To investigate this question, I have studied some local weather records. My statistical skills are about High School level: mean and standard deviation of a normal distribution.
Data for Glasgow Airport from 1959 to 2012 was obtained from the Meteorological Office website but the 2012 data was discarded as it is only provisional and represents an incomplete year. The data included monthly rainfall, sunshine and maximum and minimum temperatures and the focus of this study was the rainfall data.
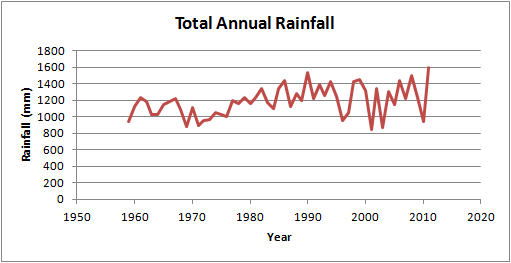
Annual rainfall figures are plotted below as a time series. The y-axis (rainfall) is drawn from zero to give a clearer picture of the relative changes; some graphs cut off the bottom which can visually exaggerate trends. Without performing any statistical analysis, the first impression is that annual rainfall has increased from the early 1970s to the mid 1990s before increasing again from around 2000 to the present time. The variability from year to year also appears to be greater in the more recent results, especially in the 2000s.Read more »