The burning question is whether this is just the natural variability of weather or whether underlying climate change has a hand in driving these weather systems. To investigate this question, I have studied some local weather records. My statistical skills are about High School level: mean and standard deviation of a normal distribution.
Data for Glasgow Airport from 1959 to 2012 was obtained from the Meteorological Office website but the 2012 data was discarded as it is only provisional and represents an incomplete year. The data included monthly rainfall, sunshine and maximum and minimum temperatures and the focus of this study was the rainfall data.
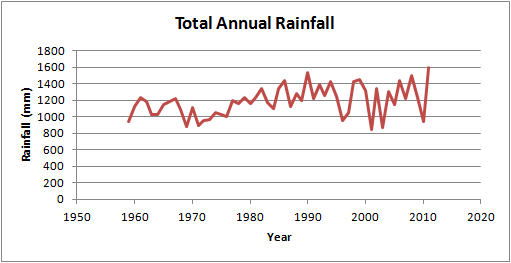
Annual rainfall figures are plotted below as a time series. The y-axis (rainfall) is drawn from zero to give a clearer picture of the relative changes; some graphs cut off the bottom which can visually exaggerate trends. Without performing any statistical analysis, the first impression is that annual rainfall has increased from the early 1970s to the mid 1990s before increasing again from around 2000 to the present time. The variability from year to year also appears to be greater in the more recent results, especially in the 2000s.